What a YouTube outlier score actually means
An outlier score is a video’s views ÷ its own channel’s recent median — a 10× means ten times the channel’s normal views. What each number means, how it’s calculated, and the traps to avoid.
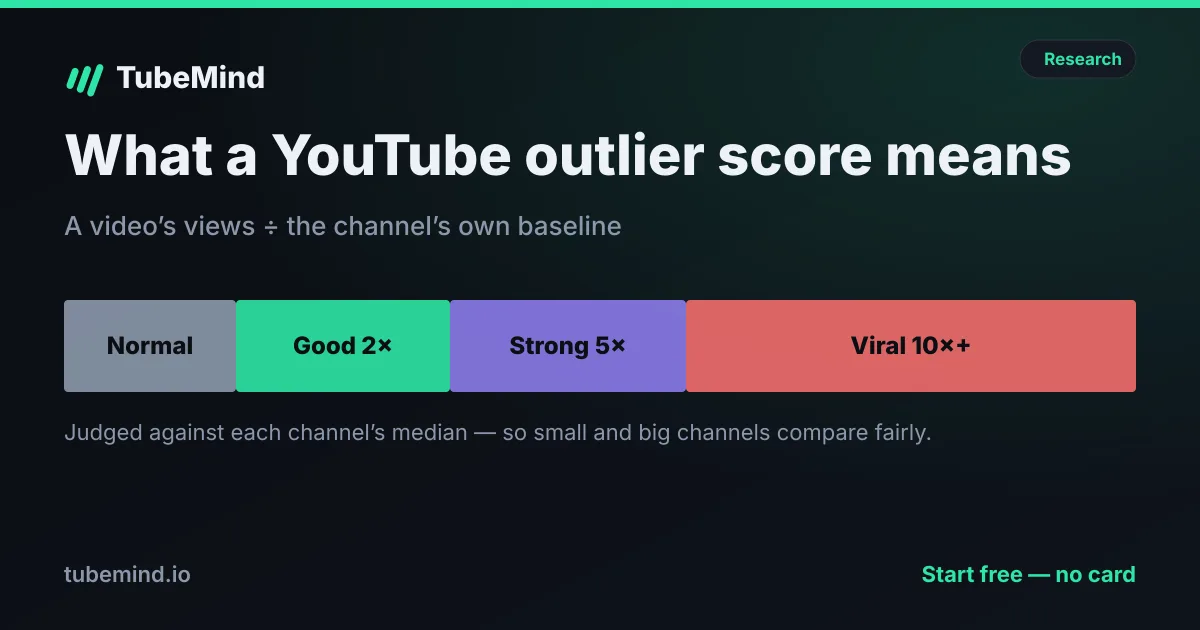
Open any outlier tool and you’ll see a little number next to each video — 3×, 8×, 24×. That number is doing more work than almost anything else on the screen, and most people never learn what it actually means. Let’s fix that in five minutes.
What the number actually is
The outlier score answers one question: how did this video do compared to what this channel normally gets? Not compared to YouTube as a whole — compared to itself. The maths is simple:
outlier score = video views ÷ median of the channel’s recent same-format uploads
So if a channel’s videos normally get 20,000 views and one hits 200,000, that’s a 10× outlier. The video did ten times the channel’s normal number. (We use the median rather than the average on purpose — one past viral hit would drag an average up and make everything after it look like a failure. The median ignores the freak result and reflects the channel’s true normal.)
What each score means in practice
| Score | What it means | How to read it |
|---|---|---|
| Under 2× | Normal performance | Business as usual — not a signal |
| 2× – 3× | A solid hit | The idea worked; worth noting |
| 3× – 5× | Strong | A clear winner — study the angle |
| 5× – 10× | A real breakout | Something about this resonated hard |
| 10×+ | Viral for that channel | Rare — copy carefully, check it’s repeatable |
Here’s the counter-intuitive part most creators miss: a repeatable 3× beats a one-off 20×. A 20× is often a fluke — a celebrity mention, a news moment, a trend that’s already over. A 3× you can hit again and again is a format, and formats are what build channels. (In our study of 627,537 videos, only 12% of breakouts reach 20×+ — most are the modest, repeatable kind.)
Why it beats raw view count
Raw views just tell you a channel is big. The outlier score tells you an idea is working — and that’s what you can actually copy.
Picture two videos, both at 500,000 views. On MrBeast’s channel, 500K is a disappointment. On a 2,000-subscriber channel, 500K is an earthquake — and it’s the small channel that matters to you, because it proves the idea works without a huge existing audience. That’s exactly the kind of channel TubeMind surfaces: small, young channels posting big outliers, because they’re the ones a new creator can realistically follow. (More on the method in YouTube outlier videos explained.)
Raw views reward who’s already big. The outlier score rewards whose idea is working — and that’s the one you can steal.
The traps: when a high score lies
A big number isn’t automatically a good signal. Four things fake a breakout:
The defence against all four is the same: look at whether other channels hit the same angle. One channel’s 15× is a fluke; five channels all landing 4×–8× on the same format is a pattern — and a pattern is what you want to copy.
Why transparent scores matter
Every outlier tool computes roughly the same metric, but they present it very differently — some use the last 10 uploads, some a hidden z-score, some a 0–100 “score” you can’t see inside. The number itself matters far less than one thing: can you see how it was calculated?
A score you can’t audit is a score you can’t trust — and the moment it’s wrong once (a frozen counter, an ad flagged as an outlier), you’ll never trust it again. That’s why TubeMind shows the raw ratio, the baseline window and the exact formula on every card, and labels every estimate as an estimate. Read the full method in how TubeMind scores work.
How to actually use it
Put it together into a simple workflow: filter for outliers on small, young channels (that’s where copyable ideas live), favour repeatable 3×–8× over one-off 20×s, confirm the pattern across several channels, then validate the whole niche with a verdict before you commit. That last step — turning a pile of outliers into an Enter / Wait / Avoid decision — is what the niche decks are for.
See outlier scores live — open the Outliers feed, check any video with the Chrome extension, or read outlier videos explained.
Sources & method
Score bands and the breakout-distribution figures (≈82% of outliers 2×–5×, under 5% at 10×+) are from the OverseerOS 2026 study of 2,622 videos and the TubeMind index (State of YouTube 2026), computed from public statistics via the official YouTube Data API. The outlier score is a research signal relative to each channel’s own baseline, not a prediction. See how scores work for the exact formula.
Frequently asked questions
What does a YouTube outlier score mean?
An outlier score is how many times a video beat its own channel’s usual views. It’s the video’s views divided by the median of the channel’s recent same-format uploads. A 10× outlier got ten times what that channel normally gets — a strong signal the idea worked, not just that the channel is big.
What is a good outlier score?
As a rule of thumb: 2×–3× is a solid hit, 3×–5× is strong, 5×–10× is a real breakout, and 10×+ is viral for that channel. Most breakouts are small — in one 2,622-video study about 82% of outliers were 2×–5× and under 5% hit 10×+ — so a repeatable 3× idea is often more useful than a one-off 20×.
How is the outlier score calculated?
Views ÷ the median of the channel’s last ~30 same-format uploads. The median (not the average) is used so one past viral hit doesn’t inflate the baseline. TubeMind shows the exact maths on every card — see how scores work.
Why use an outlier score instead of view count?
Because raw views just reward big channels. A 500K-view video is unremarkable for MrBeast but a massive breakout for a 2,000-subscriber channel — and it’s the small channel that tells you an idea is working and still copyable. The outlier score levels the playing field so you spot opportunities, not just popularity.
Is a high outlier score always good?
No. Watch for false signals: a celebrity or news spike (a one-off, not a repeatable idea), a seasonal hit, or a channel with too few uploads to have a reliable baseline. Always check whether other channels hit the same angle — that’s what separates a real pattern from a fluke.
What outlier score do different tools use?
They all compute the same core metric (views ÷ channel baseline) but band it differently — some use the last 10 uploads, some a z-score, some 3×/5×/10× colour bands. The number matters less than whether the tool shows you the maths. Opaque 0–100 scores you can’t audit are the ones to distrust.
Put this into practice
Research any channel or niche free — no card, no channel connection.
Start free →