In this guide
Key takeaways
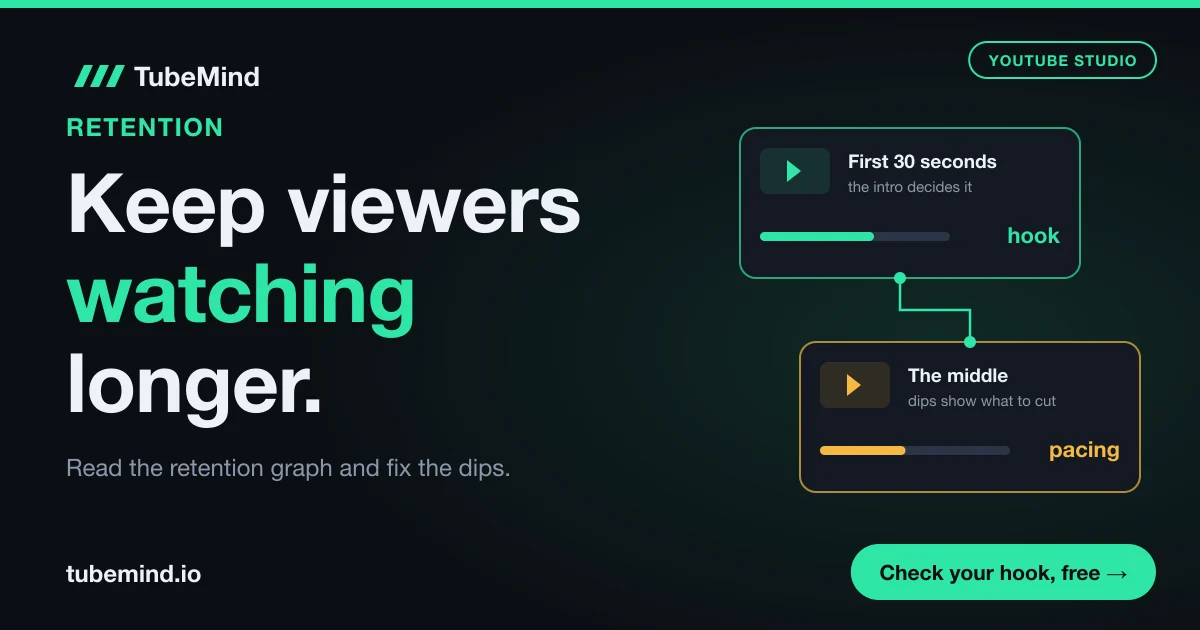
- YouTube Studio's intro figure is the share of viewers still watching after the first 30 seconds; at 50% or more, a video counts as an above typical intro (YouTube Help, checked November 2026).
- Typical retention, the grey band on the graph, is built from your own 10 latest videos of similar length, so you compete with yourself.
- Key moments (intro, top moments, spikes, dips) only appear on videos at least 60 seconds long with at least 100 views, after 1 to 2 days.
- On 3 November 2026 the median breakout video in TubeMind's data was 11 minutes long in Tech Explained and about 43 minutes in History Documentary, so there is no single right length.
- Fix one dip per video. A small fix you can repeat beats a full rewrite you cannot.
You open YouTube Studio, click a video and see a line that slides down from left to right. Most creators look at it for five seconds, feel bad, and close the tab. That is a waste, because this one graph tells you more about your video than any comment, any tag and any outside tool. It shows the exact second people left.
I have been on YouTube since 2018, and the retention graph is the first thing I open when a video does worse than I hoped. In this guide I will show you how to read it in plain words, how to find the reason behind each drop, and what to change in the next video. The opening gets its own short section, but I will not repeat what our hook generator page already covers about writing first lines. This page is about the whole video, from the first second to the end screen.
What audience retention means on YouTube
Audience retention is how much of your video viewers keep watching, moment by moment. YouTube Studio shows it as a line graph: the left edge is the start of the video, the right edge is the end, and the height of the line is the share of viewers still watching at that point.
The word "retention" gets used for three different numbers, and the top guides on this topic often mix them up. Here they are side by side.
| Number in Studio | What it means | Example |
|---|---|---|
| Audience retention graph | The share of viewers still watching at each second of the video | At 4:00, the line sits at 38% |
| Average view duration | The average minutes watched per view, among viewers who stayed past the first seconds | 4:12 on a 10 minute video |
| Average percentage viewed | The same idea as a percentage of the video's length | 42% on the same video |
The table says one thing in simple words: these numbers describe the same viewing from different sides. The graph shows where people left. Average view duration shows how long they stayed in minutes. Average percentage viewed shows how long they stayed compared with the length of the video.
A quick example makes this clearer. Say your 10 minute video has an average view duration of 4 minutes 12 seconds. That is 252 seconds out of 600, so the average percentage viewed is 42%. It does not mean 42% of people watched to the end. It could be that many people watched half and a few watched all of it. Only the graph shows which story is true.
One more detail matters in late 2026. YouTube's Help page says average view duration and average percentage viewed are calculated from engaged views, which it defines as times viewers stayed past the initial seconds. From 24 August 2026, YouTube counts a view the moment a video starts to play. So if you divide watch time by the public view count yourself, you will get a smaller number than Studio shows. Trust Studio's own retention figures and compare them only with your own past videos.
How to open the retention report in YouTube Studio
The retention report lives inside each video's analytics. It is not on the channel dashboard, because YouTube only shows it at the video level.
- Open YouTube Studio and click Content in the left menu.
- Hover over a video and click the Analytics icon.
- Open the Engagement tab. The audience retention card sits near the top. The Overview tab also shows a smaller version.
- Click See more to open the full report. Here you can compare the video with other videos and switch the viewer segment.
Two things often confuse new creators at this step. First, the data needs time: YouTube says retention data usually takes 1 to 2 days to process, so a video uploaded this morning will show little or nothing. Second, the key moments labels (intro, top moments, spikes, dips) need a video that is at least 60 seconds long and has at least 100 views. If your video has 70 views, the graph may show but the labels will not. That is normal and has nothing to do with a penalty.
How to read the shape of the retention graph
Read the graph as a story with four kinds of moments: flat parts, slow slides, bumps up and sudden drops. Each one means something different, and each one has a different fix.
| Shape | What YouTube says it means | What I would check |
|---|---|---|
| Flat line | Viewers watched that part from start to finish | What made it work, so you can do it again |
| Gradual decline | Interest fades over time; most videos taper off | Normal, unless it is steeper than your grey band |
| Spike (line goes up) | People rewatched or shared that part | Was it great, or was it unclear so people went back? |
| Dip (sudden drop) | People skipped ahead or left | What happened in the 20 seconds before it |
The middle column comes from YouTube's own Help pages. The right column is what I do with it. Look at the spike row in particular. A spike feels like good news, and often it is. But YouTube itself says a spike can also mean the content was unclear and viewers had to rewatch it. If your spike sits on a fast list of numbers or a dense explanation, that is probably confusion, and the fix is to slow down or show the point on screen.
Now look at the grey band behind your line. This is typical retention. YouTube builds it from your own 10 latest videos of similar length. If your blue line sits above the grey band, this video held people better than your usual. If it sits below, it held them worse. This is the fairest test you have, because it compares a 12 minute video with your other 12 minute videos instead of with a 40 second clip or another creator's channel.
A short example. Say your line drops to 55% at the 30 second mark while the grey band sits at 48%. Your intro is above your normal, even if 55% sounds low. Then the line falls faster than the band from minute 3 to minute 5. That stretch deserves your attention more than the start.
How to find the reason behind a dip
A dip only tells you where people left. To know why, you have to watch that part of your own video like a stranger would. I use four questions, in this order, and the answer is almost always one of them.
- What happened in the 20 seconds before the drop? Click on the graph at the dip, go back 20 seconds and play with sound. The cause is usually just before the line falls, because people need a few seconds to decide to leave.
- Did the video stop moving toward the promise? Your title and thumbnail made a promise. A drop often starts where the video goes sideways: a long backstory, a second topic, or a "before we start" section.
- Did the screen stay the same for too long? One shot of a talking head, one slide or one map held for a minute can make people leave even if the words are good.
- Did you sound like you were finishing? Lines like "so that is it" or "before I go" tell viewers the useful part is over. Many leave right there, before your end screen.
Here is how this works on a made up case. Say you upload a 12 minute video called "7 lakes in Pakistan you must see". The line holds well until 2:40, then falls 9 points in 20 seconds. You go back to 2:20 and find a long section about how you planned the trip and which car you rented. Viewers clicked for lakes. The fix is not to make the whole video shorter. The fix is to cut that minute or move it to the end, so the second lake arrives sooner.
Write each dip down in a simple log: video, time, drop size, your guess about the cause. After five or six videos, patterns show up. You may find that every video loses people right after the sponsor read, or at every map animation, or every time you change topic without a sentence that links the two parts.
The graph shows where people left. Your own video, watched again with fresh eyes, shows why.
Fix the first 30 seconds without overthinking it
The first 30 seconds matter most because this is where the largest share of viewers decide to stay or go. YouTube Studio measures it directly: the intro figure is the share of your audience still watching after 30 seconds, and videos where 50% or more are still there are listed as above typical intros.
YouTube's own advice for a weak intro is short: make the thumbnail and title match what the video delivers, and try different styles in the first 30 seconds. YouTube's guide to the recommendation system says the same in other words, telling creators to keep intros short and deliver on the promise of the title and thumbnail. So the first thing to check is a mismatch. If the thumbnail shows a finished house and the video opens with you talking about your week, people feel tricked and leave.
Three quick checks I run on any intro:
- Is the topic of the title on screen or in the first sentence within 5 seconds?
- Is there any greeting, logo animation or channel news before the topic? Move it later or cut it.
- Does the viewer know what they will get by the end, and roughly when?
If you want help with the actual opening lines, the YouTube hook generator writes and scores hooks for the first 30 seconds, and its page explains hook types in detail. I will not repeat that here. What matters for this guide is that you judge your intro against your own grey band, video by video, and change one thing at a time.
Keep the middle moving: pacing that holds people
The middle of a video is where most retention is lost slowly, and it is where most guides give the least help. The goal is simple: every minute should either answer part of the promise or give a clear reason to wait for the next part.
Here are the pacing tools that work, with what each one fixes.
| Problem in the graph | Pacing fix | Example |
|---|---|---|
| Slow slide during one long section | Cut it by a third, or split it with a new visual | A 3 minute history backstory becomes 2 minutes with a map |
| Drop when you change topic | Add one bridge line that says why the next part matters | "That explains the price. Now the part that decides if it is worth it." |
| Steady fall from the halfway point | Add a re-hook: tease what is still coming | "The lake I liked most is number six, and it is free to visit." |
| Top moment near the end | Move that content earlier | Show the result first, then how you got there |
| Drop at a sponsor or channel plug | Shorten it, place it after a strong moment | A 60 second read becomes 25 seconds after the first big reveal |
Read the table as a menu. Find the row that matches the shape you see, and try only that fix in the next video. If you try four fixes at once, you will never know which one helped.
The fourth row comes straight from YouTube. Its Help page says that if your top moments happen late in the video, you can introduce that content earlier, because audience size usually shrinks as a video plays. In plain words: fewer people are around at minute 9 than at minute 1, so your best part reaches fewer people the later it comes. A cooking video can show the finished dish in the first minute, then explain how to get there.
Visual change also matters, but it does not have to be fancy. A cut to a closer shot, a simple text label, a screen recording, a photo, or a chart all reset attention. Faceless channels in Urdu and Hindi often hold viewers with steady new visuals every few seconds, and talking head channels can do the same with B-roll and zooms. You do not need expensive editing. You need the screen to change when the idea changes.
You can catch many of these problems before you film. Paste your script into the YouTube script review and it flags slow openings, late payoffs and lines where viewers may drop. Then, once the video is live, compare its warnings with the dips in your retention graph.
Use key moments, chapters and the end of the video
Key moments are the labels YouTube adds on top of the graph: intro, top moments, spikes and dips. They are your shortcut, because YouTube has already found the parts worth looking at.
Top moments are parts where almost no one dropped off. YouTube's Help page says to find and celebrate these moments. More usefully, it suggests looking for patterns in them and making new videos that expand on them. If your top moment in three different videos is the part where you compare prices on screen, that tells you what your audience values. Make more of it, earlier.
Chapters are a different matter. They split your video into named parts on the progress bar, so viewers can jump to what they need. Some creators worry that chapters lower retention because people skip ahead. In my view, a viewer who skips to the part they want and stays is better than a viewer who leaves because they could not find it. Watch your graph after adding chapters: if one chapter gets skipped every time, that section is weak and the skip is useful feedback. The chapters generator builds the timestamps from a transcript, so this takes a minute.
The ending is the last place to win. Almost every video drops when the content ends, and that is fine. What you want to avoid is a long goodbye. If your last useful line is at 9:30 and the video ends at 10:45, many people leave at 9:30 and your average percentage viewed falls for no reason. Keep the closing short and point to one next video while viewers are still watching.
What our data shows about video length
There is no best length for retention. The right length depends on the niche, and the gap between niches is large. TubeMind cannot see the retention graphs of other channels, because only a channel owner sees those in Studio. What we can see is which long videos broke out, meaning they got at least 2 times their channel's median views, and how long those videos were.
On 3 November 2026 we checked three niches in TubeMind's index of 1.8M+ videos. Here is the length of their breakout long-form videos.
| Niche | Breakout videos checked | Median length | Length group with most breakouts |
|---|---|---|---|
| Tech Explained | 114 | 11 minutes | 8 to 20 min (70 of 114, 61%) |
| Hindi Facts & Mystery | 126 | About 15 minutes | 8 to 20 min (51 of 126, 40%) |
| History Documentary | 241 | About 43 minutes | 20 to 60 min (139 of 241, 58%) |
Let me explain what this table says. In Tech Explained, half of the breakout videos were shorter than 11 minutes and most sat between 8 and 20 minutes. In History Documentary, the middle breakout video was about 43 minutes long, almost four times longer, and more than half of all breakouts ran between 20 and 60 minutes. Hindi Facts & Mystery sat between the two, at about 15 minutes, with breakouts spread more widely across lengths.
What does this mean for retention? It means the common advice "make shorter videos to raise retention" can hurt you. A 43 minute history video that holds 35% of viewers gives each viewer about 15 minutes of watching. An 8 minute version that holds 50% gives each viewer 4 minutes. The percentage went up, the watch time went down, and the viewer who wanted a long documentary to fall asleep to or listen to during a commute did not get it. If you are still working toward the Partner Program, that lost watch time is hours you need: the watch time calculator shows how fast you reach the watch hours the Partner Program asks for at your current pace, and our guide on why a channel is not monetized covers the rest of the checklist.
So use length the way your niche uses it, then improve retention inside that length. To see the lengths of breakout videos in your own topic, search it in the YouTube outlier finder and look at the durations of the top results. For how breakouts and multipliers are worked out, see how our scores work and our guide to YouTube outlier videos.
Compare new viewers, subscribers and Shorts separately
One retention line mixes very different people, so split it before you judge it. In the full report, the segment menu lets you view the graph for groups like new viewers and returning viewers, or subscribers and non-subscribers.
This matters more than it sounds. Returning viewers already know you, so they forgive a slow start. New viewers do not. If your graph looks fine overall but the new viewer line drops hard in the first minute, your video works for fans and fails for strangers. That is exactly the group YouTube needs to win when it recommends you to someone new. YouTube's guide to its recommendation system says it looks at whether viewers stick around and whether they feel satisfied after watching, so a video that loses every stranger early has a hard time spreading.
The same report can also separate organic views from paid ones. If you ran a video ad, expect the paid line to be lower, because many of those people did not choose your video. Do not judge your editing on paid traffic.
Shorts need their own reading. For a Short, the number to watch first is stayed to watch: the share of times viewers stayed past the first seconds instead of swiping away. A long video's 30 second intro has no direct match in a 40 second Short. Compare your Shorts only with your other Shorts, and your long videos only with long videos.
A simple routine to raise retention, one video at a time
Here is the routine I would follow after every upload. It takes about 20 minutes per video, spread across the week.
- Day 2 or 3: open the retention report. Note the intro figure, whether the line sits above or below the grey band, and the time of the biggest dip.
- Same day: watch 20 seconds before that dip and answer the four questions from the dip section above. Write one line in your log.
- Same day: check the key moments. Write down any top moment and what happens in it.
- Day 7: switch the segment to new viewers. If their line falls much faster in the first minute, your opening needs work for strangers.
- Before the next video: pick one fix only. Move a top moment earlier, cut a slow section, add a re-hook, or shorten the ending.
- When writing the next script: run it through the script review to catch slow parts early.
- After 5 videos: compare their lines with the grey band. If most sit above it, the band itself will rise, because it is built from your latest videos.
That last step is the quiet win: every better video raises the grey band, so your channel keeps competing with a better version of itself.
YouTube Script Review
Paste a script before you record and see where the opening is slow, where the promise is paid too late, and which lines may lose viewers.
Review a scriptMistakes that keep retention low
- Chasing a percentage from another channel. Studio compares you with your own videos of similar length, so another creator's number tells you little.
- Making every video shorter to push the percentage up, and losing total watch time.
- Fixing five things at once, so you never learn which fix worked.
- Reading a spike as praise when the part was confusing and people rewatched it.
- Opening with channel news, a long logo, or a recap of the last video.
- A long goodbye after the last useful line.
Limits of this advice
Retention is one signal among several. A video with great retention and a weak title may still get few views, because people need to click before they can stay, and search viewers need to find it first (see how to check where your video ranks). And YouTube does not publish how much weight retention carries in recommendations, so anyone who gives you an exact formula is guessing.
The length data above covers three niches, checked on one day, and counts breakout videos by views. It does not measure retention, because TubeMind cannot see other channels' Studio data. Use it to see what length viewers in a niche accept, then use your own retention report for everything else. Retention benchmarks you see online, such as "50% is good", come from small samples or tool vendors. Your own grey band is a better benchmark than any of them.
Sources and method
Retention definitions, the 30 second intro, the 50% above typical intro line, typical retention from your 10 latest videos of similar length, key moments rules (60 seconds, 100 views, 1 to 2 days) and segments are from YouTube Help: Measure key moments for audience retention and Content tab analytics tips. Engaged views, average view duration, average percentage viewed, stayed to watch and the 24 August 2026 view counting change are from Understand your YouTube content performance. Advice on intros and satisfaction is from Understand your content performance for YouTube's recommendation system. All checked on 3 November 2026. Length data is from TubeMind niche data for Tech Explained, Hindi Facts & Mystery and History Documentary on 3 November 2026: long-form uploads with at least 2 times their channel's median views, grouped by duration. Method in how our scores work.
Writing your next video? Check the script for slow parts before you hit record, free.
Research right on YouTube: the free TubeMind Chrome extension shows the outlier multiplier, a revenue estimate and similar channels on YouTube pages.
Frequently asked questions
What is a good audience retention rate on YouTube?
There is no single good number, because retention depends on video length and niche. YouTube compares each video with your own 10 latest videos of similar length, shown as the grey typical retention band. A video above that band held viewers better than your usual. For the opening, YouTube lists videos where 50% or more are still watching after 30 seconds as above typical intros.
Why does my retention graph go up in the middle?
A rise in the line is a spike. YouTube says spikes are parts that viewers rewatched or shared. That can mean the part was very interesting, or that it was unclear and people went back to catch it. Watch the spike yourself: if it is a fast list or a dense explanation, slow it down or show the point on screen next time.
Does audience retention affect YouTube recommendations?
YouTube says its recommendation system looks at whether viewers stick around after they start watching and whether they feel satisfied afterwards. Retention is one way to see the first part. YouTube does not publish exact weights, so treat retention as one strong signal next to clicks, satisfaction and your topic, and avoid any guide that gives a precise formula.
Why is there no key moments data for my video?
Key moments (intro, top moments, spikes and dips) only show for videos that are at least 60 seconds long and have at least 100 views. Data also takes 1 to 2 days to process. A new or small video can show a retention graph without these labels. That is normal and has nothing to do with a penalty.
What is typical retention in YouTube Studio?
Typical retention is the grey band behind your retention line. YouTube builds it from your own 10 latest videos of similar length. It lets you see if one video held viewers better or worse than your usual, at every point in the video. As your newer videos improve, the band rises too, so the bar keeps moving up.
Is average percentage viewed the same as audience retention?
They are related but different. Average percentage viewed is one number: the average share of the video watched by people who stayed past the first seconds. The retention graph shows the share of viewers still watching at every moment. A video at 42% average could have many half watchers or a few full watchers. Only the graph shows which.
Should I make shorter videos to raise retention?
Not by default. A shorter video often gets a higher percentage but less total watch time per viewer. On 3 November 2026, breakout videos in TubeMind's History Documentary data had a median length of about 43 minutes, against 11 minutes in Tech Explained. Match the length your niche accepts, then cut slow parts inside that length.
Can I see the retention graph of someone else's video?
No. Only the channel owner sees retention in YouTube Studio. Public tools, TubeMind included, can see views, length and upload dates, which shows which videos broke out and how long they were. That tells you what a niche accepts. For where people leave, you need your own Studio data.
How is retention measured for YouTube Shorts?
For Shorts, start with stayed to watch: the share of times viewers stayed past the first seconds of a Short instead of swiping away. Average view duration and average percentage viewed are counted among those who stayed. Compare Shorts only with your other Shorts, because a 40 second Short and a 12 minute video are judged differently.
Did the August 2026 view count change affect retention numbers?
From 24 August 2026, YouTube counts a view the moment a video starts to play. YouTube says average view duration and average percentage viewed are calculated from engaged views, meaning views that stayed past the initial seconds. So use Studio's own retention figures. Dividing watch time by the public view count yourself will give a lower number.
YouTube par audience retention kaise badhayein?
YouTube Studio mein video ka retention graph kholein aur pehla bada dip dhoondein. Dip se 20 second pehle ka hissa dekhein: shuru mein der, title ka wada late, ya ek hi scene bohat dair tak. Agli video mein sirf ek cheez theek karein, sab se acha hissa pehle laayein, aur grey typical band se muqabla karein.