In this guide
Key takeaways
- In TubeMind’s index, the median 100K+ view video published between 1 August and 30 October 2026 had likes equal to 1.48% of its views (1.02% long-form, 1.90% Shorts).
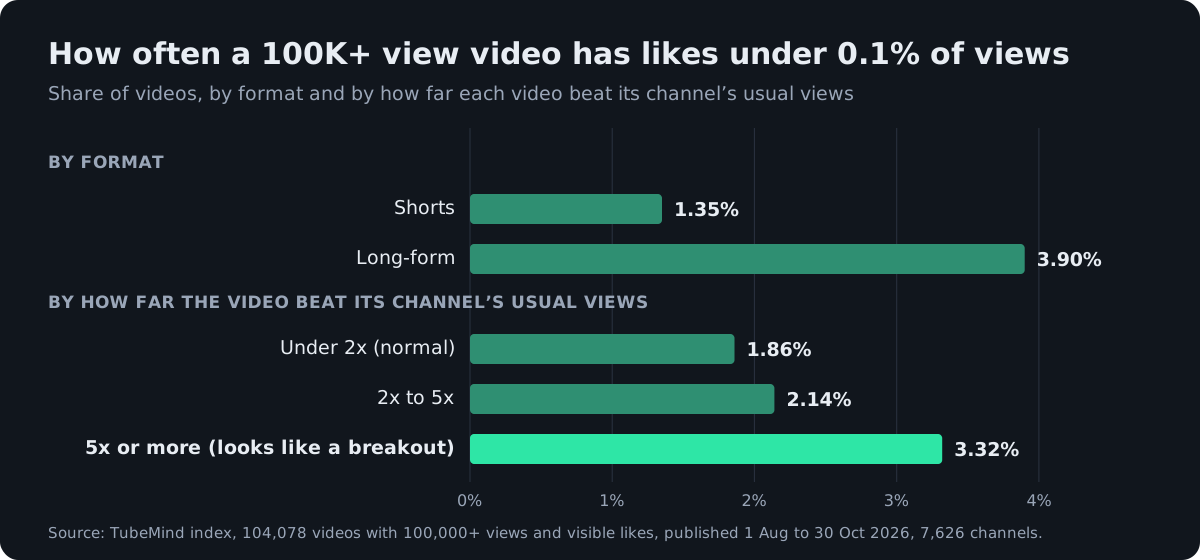
- Likes under 0.1% of views happen on 3.9% of long-form videos and 1.35% of Shorts with 100K+ views. Under 0.5% is common on long-form (25.3%), so it is not a warning sign by itself.
- Videos that look like breakouts (5x the channel’s usual views) fall under 0.1% likes 1.8 times as often as normal videos: 3.32% against 1.86%.
- Ad views are not fake. Google Ads Help says in-stream, in-feed, bumper and Shorts ads count toward the public view count from the moment the ad starts to play.
- Low likes are normal on music videos (median 0.41%), film trailers (0.34%) and kids videos (0.39%), and 6.2% of big videos hide their like count, so none of these is proof of anything.
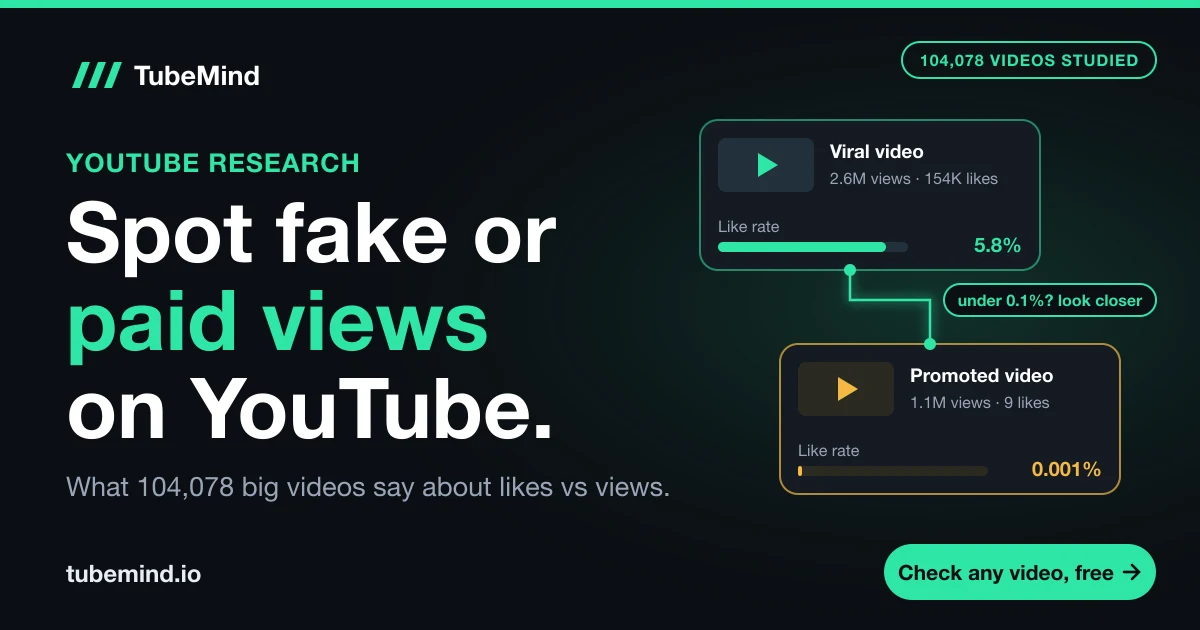
On 30 October 2026 we were checking TubeMind’s niche reports by hand and found a video from a financial services brand sitting near the top of “Videos to model” in the finance niche. It had about 1.1 million views and 9 likes. The organic breakouts we checked the same day in other niches had likes on roughly 1% to 6% of their views. That video was almost certainly an ad, not a breakout anyone could copy, and it had been fooling our own breakout list. That one example is why this guide exists, and why TubeMind now leaves videos like it out of every outlier list.
What a normal like rate looks like on a big video
For a video with 100,000 views or more, a normal like rate sits between about 0.36% and 4.08% of views, and the middle is close to 1.5%. Here is what our index shows for 104,078 videos with visible like counts, published from 1 August to 30 October 2026 on 7,626 channels:
| Format | Videos | Lowest 10% below | Median | Top 10% above | Likes under 0.1% | Likes under 0.5% |
|---|---|---|---|---|---|---|
| Long-form | 41,063 | 0.20% | 1.02% | 2.88% | 3.90% | 25.30% |
| Shorts | 63,015 | 0.56% | 1.90% | 4.61% | 1.35% | 8.33% |
| All | 104,078 | 0.36% | 1.48% | 4.08% | 2.36% | 15.02% |
Read the table from left to right. A long-form video with 100K+ views usually gets a like for every 100 views. One in ten gets fewer than 2 likes per 1,000 views, and that alone is not suspicious, because a quarter of all long-form videos are under 0.5%. The line that matters is the second to last column. Under 0.1%, meaning fewer than 1 like for every 1,000 views, only about 1 in 26 long-form videos and 1 in 74 Shorts land there. That is the small group worth a closer look.
Shorts collect likes almost twice as often as long-form, because a like is one tap while the Short is still on screen. Always compare a Short with Shorts and a long video with long videos.
Two more things move the number, and both matter before you judge a single video.
First, the size of the video. The bigger a long-form video gets, the more often its likes look thin. Among long-form videos with 100,000 to 1 million views, 3.25% are under 0.1%. Between 1 and 10 million views it is 7.01%, and above 10 million it is 14.71%, about 1 in 7 (272 videos). Huge long-form numbers are where brand campaigns, film trailers and music videos live, and those rarely collect likes in proportion. Shorts barely change with size: 1.21%, 1.60% and 2.48% across the same bands.
Second, when the video was published. YouTube changed how it counts views on 24 August 2026 (more on that below). Long-form videos published from that date have a median like rate of 0.99%, against 1.29% for long-form videos published in the three weeks before it:
| Published | Format | Videos | Middle half | Median |
|---|---|---|---|---|
| 1 to 23 August 2026 | Long-form | 7,796 | 0.49% to 2.44% | 1.29% |
| 24 August to 30 October 2026 | Long-form | 33,341 | 0.50% to 1.68% | 0.99% |
| 1 to 23 August 2026 | Shorts | 11,848 | 1.02% to 3.32% | 2.01% |
| 24 August to 30 October 2026 | Shorts | 51,507 | 0.99% to 3.14% | 1.87% |
The drop on long-form fits the new rule, since more short plays now count as views while likes do not change. It is not a clean experiment, because the older videos also kept collecting views after the change and had more time to do it. The very low end moved the other way. Long-form videos under 0.1% fell from 7.13% of those published 1 to 23 August to 3.13% of those published after. The likely reason is time: an ad campaign runs for weeks and every ad play now counts as a view, so a video that has been out longer has had more chance to be promoted. Still, the practical lesson holds: compare a new video with new videos. Benchmarks published before late August 2026 will make today’s videos look worse than they are.
Fake views, ad views or a sponsored video: three different things
A video with lots of views and few likes can be one of three things, and only one of them breaks YouTube’s rules.
| Fake views | Ad promoted views | “Includes paid promotion” label | |
|---|---|---|---|
| What it is | Bots or paid services that inflate the count | The video runs as a Google Ads campaign | A brand paid the creator to feature it |
| Allowed? | No. Against the fake engagement policy | Yes | Yes, and creators must disclose it |
| Counts in public views? | YouTube removes artificial views it detects | Yes, from the start of playback | Not related to how views are counted |
| Typical like rate | Very low | Very low, because ad viewers rarely like | Normal: median 1.68% in our index |
YouTube’s fake engagement policy says it does not allow “anything that artificially increases the number of views, likes, comments, or other metrics”. Running the video as an ad is different: it is a paid placement YouTube sells, and Google says those plays count publicly (more on that below). The paid promotion label is a third thing entirely. YouTube’s disclosure page asks creators to tick it when they feature “branded content, sponsorships, endorsements, or other commercial relationships”. It says nothing about where the views came from, and in our index the 3,040 big videos with that label have a slightly higher like rate than average.
Do YouTube ad views count toward the public view count?
Yes. Google Ads Help says public views are “counted the moment a video ad starts to play across Shorts ads and in-stream ads (Skippables, Nonskip and Bumper)” (Google Ads Help, checked 30 October 2026). Many older articles still say an ad view only counts after 30 seconds. That rule now applies to what an advertiser is billed for, not to the number you see under the video.
So when a brand spends money promoting a video, millions of people can see the start of it as an ad, the public count jumps, and very few of them like it. The video looks like it went viral with no engagement. It did not cheat. It paid.
The counting changed for everyone in 2026 as well. YouTube’s own help page now says “views are counted the moment a video starts to play across all formats” (How engagement metrics are counted), a change that began on 24 August 2026. Every view count got a little bigger, which pulls like rates down a little across the board.
How to check a video, step by step
Work through these in order. The first four use numbers anyone can see on the video page.
- Work out the like rate. Divide likes by views and multiply by 100, or paste the link into the engagement rate calculator. Compare it with the tables above for the same format, size and category. Under 0.1% on a 100K+ view video is the line worth noticing, unless it is a music video, a trailer or a 10 million view giant.
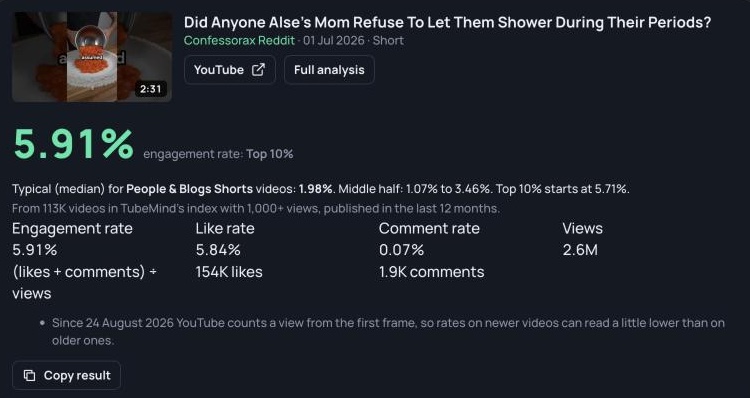
- Check the comments per 1,000 views. The median long-form video with 100K+ views gets 0.67 comments per 1,000 views, and a Short gets 0.18. In our index, only 3.59% of big long-form videos are low on both likes (under 0.1%) and comments (under 0.1 per 1,000 views). A video low on both is in a small group.
- Compare it with the channel’s other uploads. If every other video gets 2,000 views and this one has 2 million with almost no likes, something outside the channel’s audience drove it. Paste the channel link into TubeMind’s channel search to see its recent uploads, each with its multiplier against the channel’s usual views, run a free channel audit, or check one video’s numbers with the video stats tool.
- Look at the timing. A huge count in the first day or two on a small channel, with a low like rate, fits an ad campaign better than a slow organic climb. Sorting TubeMind’s outlier feed by views per hour shows how fast a video moved.
- Read the comments themselves. Many generic comments (“nice video”, emoji only) posted at the same time is a pattern people report with bought engagement. Treat this one as a judgment call; there is no number to check it against.
- If it is your own channel, open YouTube Studio. Traffic sources, geography and watch time show what outsiders cannot. A spike from “External” or an unfamiliar country with very short watch time is the strongest sign you can get.
Why breakouts are where fake looking views hide
This was the surprise in our data. Among 100K+ view videos, the ones that look like breakouts, at 5x or more of their channel’s usual views, have likes under 0.1% in 3.32% of cases. Normal videos, under 2x, are at 1.86%. A video that looks like a breakout is about 1.8 times as likely to have almost no likes.
The reason is simple. Nothing makes a video jump 50x above a channel’s normal faster than a paid campaign. If you study outlier videos to find ideas, this matters: some of the biggest “outliers” are budgets, not ideas. Copying one copies an ad spend you do not have. TubeMind now leaves out any video with 100K+ views and likes under 0.1% from its outlier lists, and leaves big brand channels out of the “videos to model” lists, so a big multiplier there is far more likely to be a real idea. If you are still learning to read those numbers, start with what a good outlier score means.
Like rates by category: music and trailers run low
Category changes what normal looks like more than anything else. These are long-form videos with 100,000+ views in each YouTube category that had at least 500 of them in our sample:
| YouTube category | Videos | Median like rate | Likes under 0.1% |
|---|---|---|---|
| Gaming | 3,567 | 1.49% | 0.06% |
| Autos & Vehicles | 554 | 1.47% | 0.72% |
| Comedy | 717 | 1.40% | 0.00% |
| Science & Technology | 2,371 | 1.33% | 1.60% |
| News & Politics | 2,807 | 1.32% | 0.32% |
| People & Blogs | 5,064 | 1.09% | 1.46% |
| Education | 7,115 | 1.05% | 8.90% |
| Howto & Style | 1,138 | 0.95% | 1.05% |
| Entertainment | 10,448 | 0.94% | 5.32% |
| Sports | 2,159 | 0.91% | 0.42% |
| Music | 1,534 | 0.41% | 7.30% |
| Film & Animation | 3,123 | 0.34% | 4.67% |
Two patterns stand out. Music and Film & Animation sit around a third of the overall like rate, because music videos and trailers are watched by huge passive audiences who rarely tap like. A music video under 0.5% is ordinary. The second pattern is in the last column. Education and Entertainment have the most videos under 0.1%, 8.90% and 5.32%, while Gaming and Comedy have almost none. Those two are where brands, apps and course sellers run the most video ads, which fits everything above. If a big Education or Entertainment video has almost no likes, ad promotion is the first explanation to rule out.
When a low like rate is not a warning sign
- Kids content. Videos made for kids had a median like rate of 0.39% in our index, a quarter of the overall figure, because young viewers rarely like videos and some features are limited on kids content.
- Hidden likes. 6.2% of the 110,995 big videos in our sample hide their like count. YouTube lets creators hide likes on any video, and dislikes have been private for everyone since November 2021. A hidden number proves nothing.
- Long-form in general: A quarter of long-form videos are under 0.5%. Only the very bottom is unusual.
- Sponsored videos: the paid promotion label had a normal like rate, 1.68%, so it is not a red flag on its own.
- Ad campaigns. A low like rate on a brand’s own channel is far more likely to be ad promotion, which is allowed, than fake views.
To look at the channel behind a video, the subscriber count checker shows its growth, the channel age finder shows when it started, and the channel comparison puts it next to similar channels.
If your own views fell instead, why your YouTube views are dropping explains how to find the cause in YouTube Studio.
What YouTube does about fake views
YouTube filters views as they come in. Its help page says “it takes our systems some time to figure out which views, likes, dislikes, and subscriptions are legitimate”, and that it “may temporarily slow down, freeze, or change your metric count, and discard low-quality playbacks” (YouTube Help). That is why a count can stall or even drop.
When YouTube finds artificial traffic, it is not counted and can bring strikes. Under the fake engagement policy, a first case usually gets a warning, 3 strikes in 90 days can end a channel, and YouTube “may also terminate your channel or account after a single case of severe abuse”. Buying views also leaves you with a number YouTube may take back, and a channel history a future sponsor or buyer can check.
Want to check a video right now? Open the engagement rate calculator, paste the link and compare its like rate with the table above.
Method and sources. TubeMind index, 104,078 public videos with 100,000+ views and visible like counts, published 1 August to 30 October 2026 on 7,626 channels, queried 30 October 2026. Like rate = likes ÷ views. Live streams are excluded. Kids, hidden likes and paid placement figures use all 110,995 videos with 100K+ views in the same window. Categories are YouTube’s own video categories; the category table shows long-form only and categories with 500+ videos. Counts are public YouTube statistics at the time of our last refresh, so they are estimates of a moving number; see how TubeMind scores work. Official sources: YouTube Help on fake engagement (3399767), engagement metrics (2991785), paid promotion disclosure (154235) and like visibility (57404), and Google Ads Help on public views (2375431), all checked 30 October 2026.
Research right on YouTube: the free TubeMind Chrome extension shows the outlier multiplier, a revenue estimate and similar channels on YouTube pages.
Frequently asked questions
Can YouTube tell if you buy views?
YouTube says it checks views as they arrive and may slow down, freeze or change counts while it decides which ones are legitimate. Views it finds artificial are not counted, and the fake engagement policy can bring a warning, strikes or, for severe abuse, termination. No outside tool can see what YouTube removed, so a clean looking count is not a guarantee either.
What is a normal like to view ratio on YouTube?
For videos with 100,000+ views in TubeMind’s index (August to October 2026), the median was 1.48% of views: 1.02% for long-form and 1.90% for Shorts. Eight in ten videos fell between 0.36% and 4.08%. Music videos and film trailers run much lower, around 0.4%, and new videos published after YouTube’s 24 August 2026 counting change run a little lower than older ones.
Do YouTube ad views count as real views?
Yes, they count in the public view count. Google Ads Help says public views are counted the moment an in-stream, bumper or Shorts ad starts to play. That is why a promoted video can have millions of views and very few likes without breaking any rule.
Does a low like rate mean the views are fake?
No. It means the video is worth a closer look. Kids videos, ad campaigns and many long-form videos have low like rates for normal reasons. Check comments, the channel’s other uploads and the timing before drawing a conclusion, and remember that only the channel owner can see traffic sources.
Why can’t I see the likes on some YouTube videos?
Creators can hide the like count on any video, and dislike counts have been private across YouTube since November 2021. In our sample, 6.2% of videos with 100,000+ views hid their likes, so a hidden count is common and proves nothing on its own.