In this guide
Key takeaways
- In TubeMind's sample of 405,572 long-form uploads from the last 180 days, only about 1 in 5 reached twice its channel's usual views, so most "drops" after a hit are a return to normal.
- YouTube's own team said in September 2025 that there was no systemic view problem and named four causes: return to baseline, seasonal habits (especially around August), ad blockers and competition.
- Since 24 August 2026 a public view counts from the first frame, while most of YouTube Analytics, including CTR and retention, still runs on engaged views.
- YouTube Help says half of all channels and videos have an impressions CTR between 2% and 10%, so a CTR inside that range is rarely the whole story.
- Policy problems cut reach in ways you can see: a warning or strike, an age restriction, a copyright claim, or Shorts that re-upload other creators' work (reach cut from 1 October 2026).
A view drop feels personal, and the internet makes it worse. Search for it and you get "shadowban" theories. This guide does something simpler. It walks you through the exact reports in YouTube Studio that tell you why your views fell, in the order I would check them, and what each answer means for your next upload. If you only want a quick outside view of your channel first, run the free YouTube channel audit, then come back here for the Studio side, which only you can see.
First check: is this a drop, or your channel going back to normal?
Most view drops are a return to your usual level after a video did better than normal. Before you change anything, find out what "normal" means for your channel.
Here is the problem. When one video takes off, your whole channel lifts with it for a few weeks. Old videos get suggested next to the hit, new subscribers watch a few uploads, and your graph climbs. Then the hit slows down, the extra traffic fades, and the graph slides back. It looks like a fall. In many cases it is the same channel you had before the hit.
YouTube said the same thing in plain words. In a September 2025 update from TeamYouTube, after many creators reported drops, the team wrote that its checks found the viewership systems working correctly and "no systemic issue that is impacting creators". The first reason it listed was a "return to the baseline" after a big spike.
So the first test is about the date range you are looking at. Do this:
- Open YouTube Studio, then Analytics, and set the date range to the last 365 days.
- Look at the shape of the Views chart. Find the high point and ask: was it one video?
- Now ignore the peak and compare today with the weeks before the peak. If they are about the same, your channel did not lose anything. It lost a bonus.
Say your channel usually gets around 2,000 views a day. In June one video takes off and the channel jumps to 9,000 a day for three weeks. By August you are at 2,300 a day. Compared with June, that is a fall of almost 75%. Compared with your normal, you are up 15%. Both numbers are true, but only the second one tells you how your channel is doing.
The six causes, and what each looks like in Studio
Each cause leaves a different fingerprint in YouTube Studio. The table below matches what you see with what probably happened and where to look next. I explain each one in more detail below the table.
| Cause | What you see in Studio | Where to check | What it usually means |
|---|---|---|---|
| Return to baseline | A sharp peak a few weeks ago, today close to the level before it | Overview, 365 day range | Nothing broke. Study why the hit worked. |
| Seasonal dip | The same dip at the same time last year | Advanced mode, add a comparison with last year | Your audience is busy elsewhere. Wait it out. |
| One traffic source fell | Search steady, but Browse features or Suggested videos sharply lower (or the other way round) | Content tab, How viewers find your content | One door closed. Fix the reason for that door. |
| Fewer impressions or lower CTR | Impressions down, or impressions steady with fewer clicks | Reach and the impressions report | Topic or packaging stopped pulling. |
| Counting change | Public counts and Studio numbers stop lining up after 24 August 2026 | Compare engaged views with engaged views | Your audience may not have changed at all. |
| Policy problem | A warning, strike, age restriction, claim, or Shorts reach cut | Content tab Restrictions column, email, channel status | Fix or appeal it before anything else. |
Read the table one row at a time and compare it with your own Studio. The second column is the key. A baseline drop and a traffic source drop can look the same on the main chart, but the traffic source report separates them in seconds: in a baseline drop, the sources that grew during the hit shrink back together, while in a traffic source drop one line falls and the others stay flat.
For example, imagine your Search views stayed at about 400 a day all year while Browse features fell from 1,500 to 600. Your topic is still being searched. What changed is how often YouTube showed your videos on viewers' home pages, and that points you to the impressions and CTR checks further down.
Seasonal dips: compare with the same weeks last year
If your views fell at the same time last year, the season is the most likely cause. Viewing habits move with school, holidays, weather and religious calendars, and YouTube expects this.
In the same TeamYouTube update, seasonal viewing habits were the second reason on the list, with a specific note that there are "significant shifts in viewership, especially around August as summer ends". If your drop started in late August or September, check this before anything else.
The cleanest way to see it is in Advanced mode. Open Analytics, click Advanced mode, pick the last 28 days, then use Add comparison and pick the same 28 days a year ago. You now see two lines over each other. If both lines dip in the same week, you are looking at a season.
Different topics have different seasons. A few patterns to think about for your own audience:
- Study and exam channels often slow in holidays and rise before exams.
- Gift, tech and shopping videos tend to rise towards the end of the year.
- For a Pakistani or Indian audience, check last year's Ramadan, Eid and cricket tournament weeks, because daily routines change a lot in those weeks.
- Travel and outdoor channels follow the weather in the countries where your viewers live.
These are patterns to test against your own data, so treat them as questions. Your channel's chart from last year is the only answer that counts. If your channel is younger than a year, use a related keyword instead: TubeMind's trending keywords page shows which words are rising in new video titles over 7, 30 or 90 days and how those videos perform, a good hint whether the whole topic is cooling or only your channel.
Traffic sources: find out which door closed
Your total views are the sum of several separate doors, and usually only one of them closes at a time. The traffic source report tells you which one.
Open Analytics, go to the Content tab, and find the report called How viewers find your content (on some channels you see it as Traffic source in the Reach tab). Set the date range to cover a few weeks before and after the drop. You will see lines for sources such as these:
| Traffic source | Where the viewer came from | If this one fell, look at |
|---|---|---|
| Browse features | Home page, subscriptions feed, Watch later | Impressions and CTR on recent uploads |
| Suggested videos | Next to or after other videos | Which videos used to send you traffic (click the source for the list) |
| YouTube search | Search results | Whether the topic is still searched, and who now ranks above you |
| Shorts feed | Swiping in the Shorts player | Originality of recent Shorts and swipe-away rate |
| External | Websites and apps that embed or link your video | Whether one site that sent traffic stopped |
| Notifications and channel pages | Your own subscribers coming to you | Upload gaps and how loyal viewers feel about recent topics |
Two cases deserve a closer look. First, Suggested videos. If a big channel's video used to recommend yours and that video has now slowed down, your Suggested traffic falls with it, and nothing on your side changed. Click Suggested videos in the report and you will see exactly which videos sent you viewers. If one of them was responsible for most of it, you have found your cause.
Second, the Shorts feed. On 1 October 2026 YouTube announced that its Shorts recommendations would "reduce the reach of content re-uploaded from other creators without adding anything of your own". Channels that mainly aggregate other people's clips "will likely see less distribution within the Shorts feed". If your Shorts views fell in October 2026 and your Shorts reuse clips from others, this update is the first suspect. The fix is your own commentary, edit or story on every clip, as the announcement itself says.
Impressions, CTR and retention: the three number check
If the drop is in Browse or Suggested traffic, three numbers explain almost every case: how often YouTube showed your video (impressions), how often people clicked (click-through rate), and how long they stayed (average view duration and retention).
First, the definitions. YouTube counts an impression when your thumbnail is shown on YouTube for more than one second with at least half of it visible. Impressions from outside sites, end screens and notifications are not counted. The YouTube Help page on impressions and CTR also says that "half of all channels and videos on YouTube have an impressions CTR that can range between 2% and 10%", and that a video shown a lot on the home page naturally gets a lower CTR.
Now compare your last five uploads with the five before them, using these three numbers. The pattern tells you what broke:
| Impressions | CTR | Retention | Most likely cause |
|---|---|---|---|
| Down | Same | Same | YouTube is testing your videos with fewer people. Often a topic or audience shift. |
| Same | Down | Same | Packaging: the title and thumbnail stopped pulling clicks. |
| Same | Same | Down | The video itself: slow intro, weaker topic, or promise not delivered. |
| Down | Down | Down | A bigger change: new format, new topic, or long upload gap. Check everything. |
| Up | Down | Same | Usually fine. YouTube is showing you to colder viewers who click less. |
The last row is the one that fools most people. Say a video got 20,000 impressions at a 7% CTR last month. This month YouTube showed it 60,000 times and the CTR fell to 4%. The CTR looks worse, but 4% of 60,000 is 2,400 clicks, against 1,400 before. You got more views, from a wider audience. A lower CTR on its own is never a reason to panic. Check it next to impressions every time.
Now a problem case, also hypothetical. Your impressions are steady at 30,000 per video, but CTR fell from 6% to 3.5% over your last five uploads. That is 1,800 clicks per video falling to 1,050. Nothing else changed. This points straight at packaging. Test your next thumbnail in the free thumbnail tester to see how it looks small on a phone next to other videos, because most thumbnails lose at that size.
If retention is the number that fell, open one recent video and look at the audience retention graph. A steep drop in the first 30 seconds means the opening does not match what the title and thumbnail promised. Fix that first, because no amount of new packaging helps a video people leave early.
The 24 August 2026 view counting change: when your numbers stop matching
On 24 August 2026 YouTube changed what a view is, so comparing view counts from before and after that date can make a drop look smaller or bigger than it is.
Here is what changed, from YouTube's own announcement on the YouTube Official Blog and the YouTube Help page on how engagement metrics are counted:
- A public view now counts "from the very first frame", in long-form videos, Shorts and live.
- The older, stricter measure (clicking to watch, or watching past the first seconds) is now called an engaged view.
- YouTube says "the vast majority of analytics remain anchored on engaged views", and that CTR, average view duration and retention are calculated as before.
- Partner Program earnings still use engaged views and engaged watch hours, and eligibility still uses qualified views.
What does this mean for a drop? The new public count is looser, so it usually goes up for the same audience. That can hide a real fall. Imagine your engaged views dropped 20% in September while your public counter climbed. If you only watch the public counter, you would think things are fine.
It can also invent a drop. Say you wrote down "45,000 views" for a video in July, and today you check engaged views in Studio for a September upload and see 30,000. You are comparing two different measures. The only fair comparison is engaged views against engaged views, inside Studio, for both periods.
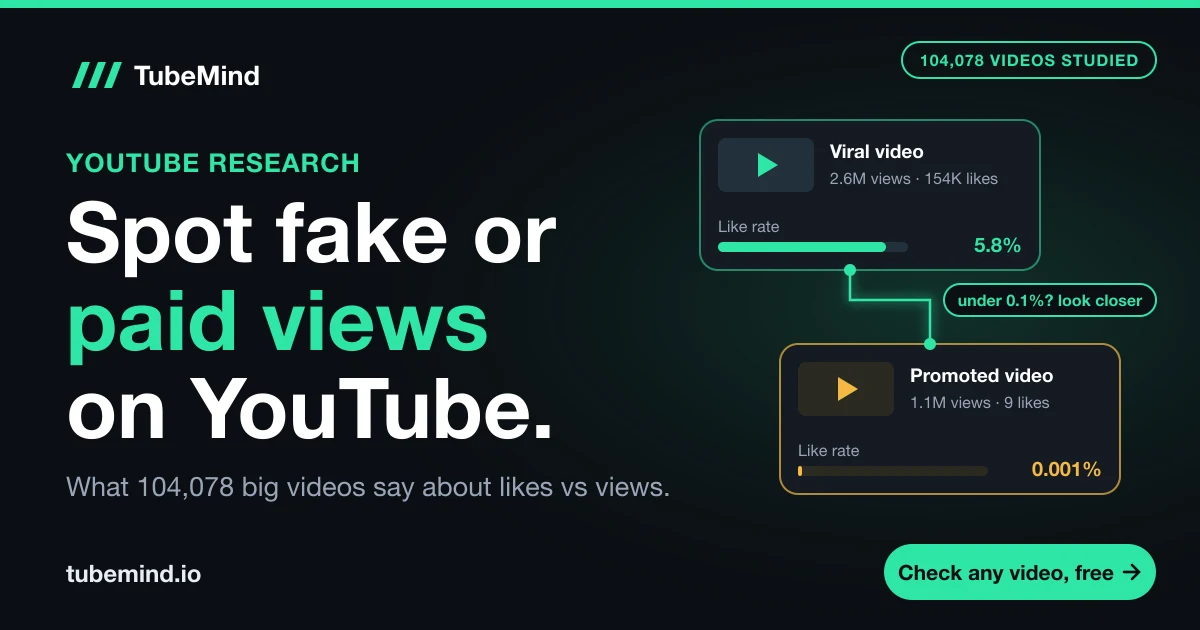
The change also moves ratios that people use to judge a video. In TubeMind's index, long-form videos published from 24 August 2026 had a median like rate of 0.99%, against 1.29% for those published 1 to 23 August, because more short plays now count as views while likes do not. If your likes per view look weaker since September, this is likely part of the reason. Our post on how to check if YouTube views are fake has the full like rate data, and the YouTube pay per view guide explains why your RPM can look lower after the change while your income holds.
Policy problems that cut reach
A policy problem is the least common cause of a drop, but it is the one you must rule out first, because it does not fix itself by waiting.
Look in three places. Your email and Studio notifications, the Restrictions column on the Content tab (it shows age restrictions, copyright claims and other limits per video), and your channel status page. Here is what each problem does, according to YouTube's own policies:
- Community Guidelines warning or strike. The first violation is usually a warning. A first strike stops you uploading for one week, the strike stays on your channel for 90 days, and three strikes in 90 days can remove the channel. A week with no uploads alone can pull your graph down.
- Age restriction. An age-restricted video is not shown to signed-out viewers or viewers under 18, so it reaches fewer people.
- Copyright claims. Depending on the rights owner's choice, a claim can block a video in some countries or worldwide. Check the Restrictions column for any video whose views stopped suddenly.
- Removed invalid views. YouTube may "temporarily slow down, freeze, or change" a count while it checks views, and it discards low quality playbacks. If one video's count went backwards, this is usually why.
- Reused content on Shorts. As covered above, re-uploaded Shorts lost reach from 1 October 2026.
What about Restricted Mode? Many creators blamed it in 2025. TeamYouTube answered directly: Restricted Mode is off by default, is used by "a small fraction" of daily viewers, and "is not causing a drop in views". I would not spend time there.
And the word "shadowban"? YouTube does not describe any hidden penalty by that name in its Help Center. The limits it does document are the ones in this list, and each of them leaves a visible trace: an email, a notice, or a mark in the Restrictions column. If you find none of those, your drop has another cause from the sections above.
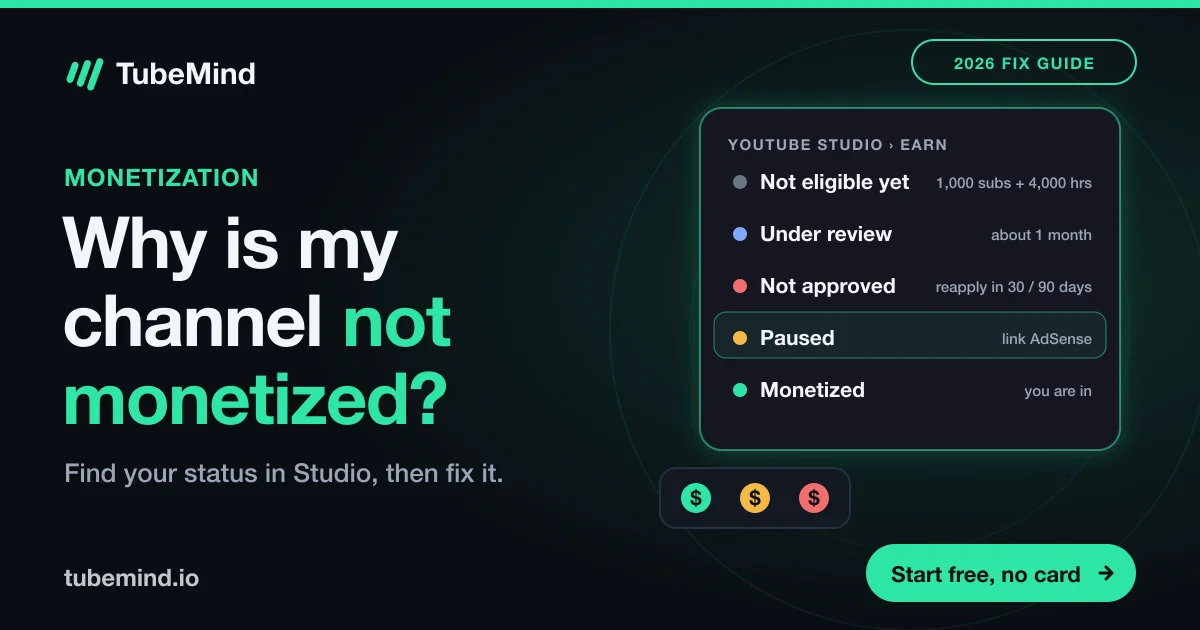
One more thing to keep apart: a yellow dollar icon (limited ads) affects how much a video earns. It does not hide the video from viewers. If your monetization status changed at the same time as your views, read why your YouTube channel is not monetized, which explains each status and what to do.
What our data shows: breakouts are rare, so the comedown is normal
TubeMind's data supports the "return to baseline" explanation with numbers: a breakout is the exception for almost every channel, so the video after it usually looks like a drop.
On 3 November 2026 we looked at 405,572 long-form uploads from the last 180 days in TubeMind's index, on channels with at least five earlier videos to compare against. For each upload we compared its views with its own channel's usual views (the channel median). Here is what came back, by the day the video was published (UTC):
| Day published | Uploads | Share that reached 2x the channel's usual views |
|---|---|---|
| Monday | 53,696 | about 20% |
| Tuesday | 57,268 | about 20% |
| Wednesday | 58,939 | about 19% |
| Thursday | 59,788 | about 20% |
| Friday | 63,083 | about 20% |
| Saturday | 59,847 | about 21% |
| Sunday | 52,951 | about 21% |
| All days | 405,572 | about 1 in 5 |
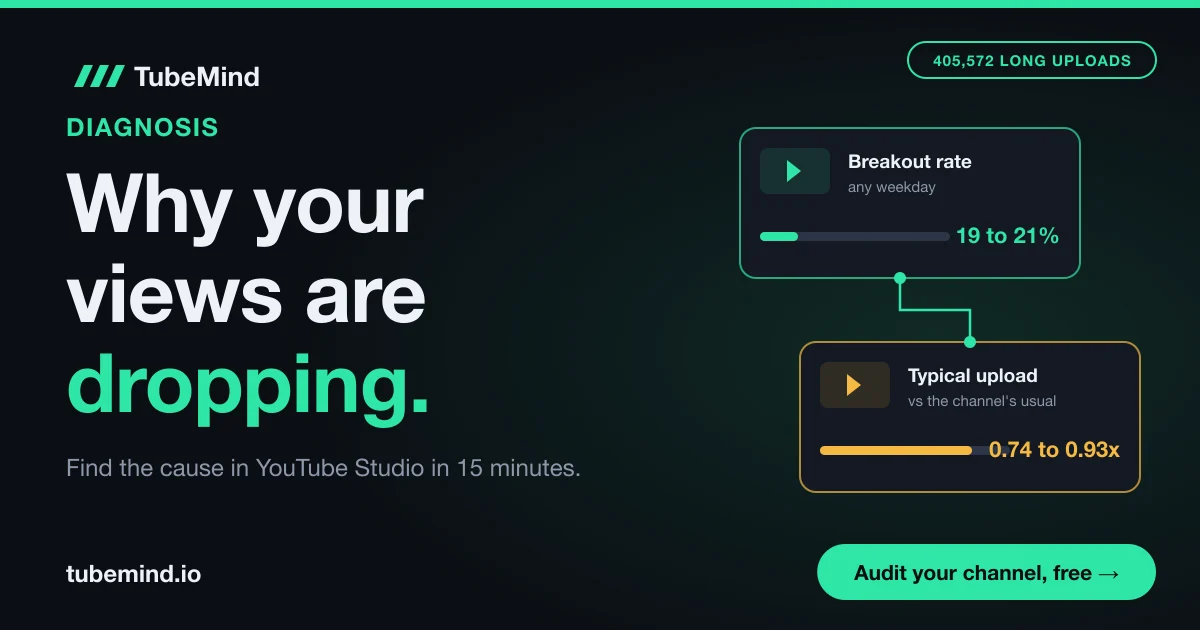
Two things stand out. First, only about one upload in five reached double its channel's normal views, on any day of the week. So if your last video was the one in five, the next one landing back near your usual number is the expected result.
Second, in every one of the 168 weekday and hour slots we measured, the middle upload got less than its channel's usual views, between about 0.74 and 0.93 times. Recent videos have had less time to collect views, so a new upload sitting a little under your average in its first weeks is normal. Do not compare a 5 day old video with your channel's lifetime average.
The day of the week barely matters. The best day, around 21%, was only about 2 points better than the weakest, around 19%. If you suspect that changing your upload day caused your drop, this data says it is unlikely to be the main cause. You can check your own niche and time zone in the best time to post heatmap, which uses the same data. Our method is explained on the how our scores work page.
Your 15 minute diagnosis, step by step
Here is the whole process in the order I would run it. Stop at the first step that explains your drop.
- Rule out policy. Check email, Studio notifications, the Restrictions column and your channel status. A strike, claim or age restriction comes first because waiting will not fix it.
- Zoom out. Set Analytics to 365 days. If today matches the level before a recent peak, it is a return to baseline. Study what made the peak work and make more of that.
- Compare with last year. In Advanced mode, add a comparison with the same weeks a year ago. Same dip last year means a season.
- Open traffic sources. Find the one line that fell. Click into Suggested videos or External to see which source stopped sending viewers.
- Run the three number check. Impressions, CTR and retention for your last five uploads against the five before. Use the pattern table above.
- Check the counting change. If your comparison crosses 24 August 2026, compare engaged views with engaged views only.
- Check the topic. Search your topic in the outlier finder to see whether other channels are still getting breakouts on it. If nobody is, the topic has cooled for everyone.
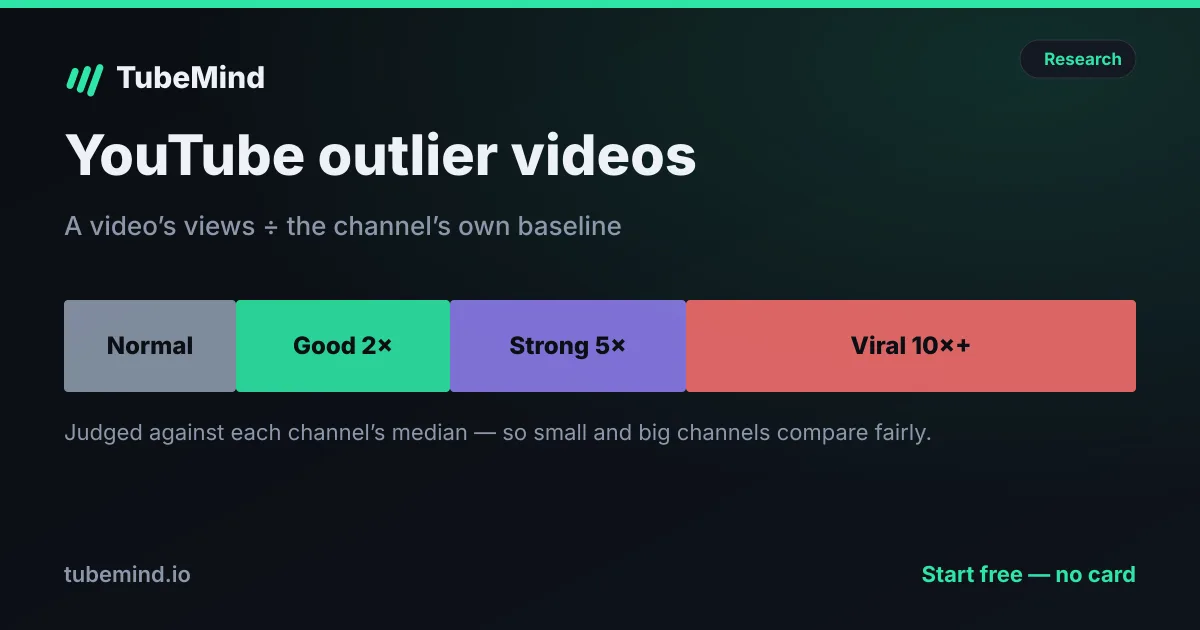
For a single video that stopped growing, the free video stats checker shows its views per day and every other public number, which helps you see whether one video slowed down or the whole channel did. For more on why one video can carry a whole channel for weeks, read our guide to YouTube outlier videos.
Mistakes that make a drop worse
Some of the most common reactions to a drop do more harm than the drop itself. Avoid these while you work out the cause:
- Deleting low view videos. They rarely hurt your channel, and deleting them throws away any search traffic they still get. Their watch hours also stop counting toward the Partner Program.
- Changing title, thumbnail, topic, length and upload day all at once. If views come back, you will not know which change helped.
- Judging a new upload after a few hours. YouTube's own advice is to read CTR after a video has a substantial number of impressions.
- Buying views or joining view exchange groups. Those views can be removed, and fake engagement is against YouTube's policies.
- Re-uploading the same video to "reset" it. Two copies split the views and comments between them, and on Shorts, reused content now gets less reach.
Where this method does not fit
This process works for most channels, but it has limits, and you should know them.
Very small channels do not have enough data. If your videos get a few hundred views each, a swing of 30% can be pure chance, and CTR on a few thousand impressions moves a lot. Wait until you have at least several weeks of steady uploads before you read patterns.
Some causes do not show up in Studio at all. The TeamYouTube update named ad blockers and browser extensions as something that "can impact the accuracy of reported view counts", and it named competition: viewers simply watching other videos and topics. Studio cannot show you either one directly. If you check every step above and find nothing, those two are what is left.
The TubeMind numbers in this post come from public data. They show how common breakouts are across many channels, but they cannot see your CTR, retention or traffic sources. Only your Studio can, which is why every step above happens there.
How I checked these facts. TubeMind data: 405,572 active long-form uploads published in the last 180 days on channels with at least 5 earlier videos, from TubeMind's best time to post data, queried 3 November 2026; a "2x" upload has views at least twice its channel's median. Weekday shares are rounded from hourly cells, so read them as about plus or minus half a point. Like rate figures are from TubeMind's 104,078 video study of 30 October 2026. Official sources, all checked 3 November 2026: YouTube Official Blog, engaged views explained (19 August 2026); YouTube Help on engagement metrics (2991785), impressions and CTR (7628154 and 9314486), age-restricted content (2950063), Community Guidelines strikes (2802032), and Advanced mode in Analytics (9717005); TeamYouTube posts in the YouTube Help Community on view counts and Restricted Mode (15 September 2025) and on original content in Shorts (1 October 2026). Studio menu names change over time and may differ slightly on your channel.
Want an outside view of what changed? Run a free channel audit for a 0 to 100 score built from your last 30 uploads, with the three fixes that matter most.
Research right on YouTube: the free TubeMind Chrome extension shows the outlier multiplier, a revenue estimate and similar channels on YouTube pages.
Frequently asked questions
Is my YouTube channel shadowbanned?
YouTube does not describe any hidden penalty called a shadowban in its Help Center. The limits it does document, such as warnings, strikes, age restrictions, copyright claims and reduced reach for re-uploaded Shorts, all leave a visible trace in your email, Studio notifications or the Restrictions column. If none of those appear, look at baseline, season, traffic sources and CTR instead.
Did the 24 August 2026 view change lower my views?
It should not lower them. Since 24 August 2026 a public view counts from the first frame, which usually makes public counts higher for the same audience. Most YouTube Analytics, including CTR and retention, still runs on engaged views. A drop appears only if you compare an old public count with a new engaged view number, so compare engaged views with engaged views.
How long does a YouTube view drop last?
It depends on the cause. A return to baseline does not recover, because your old level was the normal one. A seasonal dip usually lifts when the season ends, which you can check against last year. A strike limits uploads for one week and stays for 90 days. Packaging or topic problems recover only after you change your next uploads and give them a few weeks.
Should I delete videos that get low views?
Usually no. A low view video rarely drags down the rest of your channel, and deleting it throws away any search traffic it still gets and removes its watch hours from your Partner Program count. Make it private only if it breaks a policy or no longer reflects your channel. Spend the time on your next upload instead.
What is a good click-through rate on YouTube?
YouTube Help says half of all channels and videos have an impressions CTR between 2% and 10%. A good CTR is one that holds steady as your impressions grow. A falling CTR with rising impressions is often fine, because YouTube is showing you to new viewers. A falling CTR with flat impressions points to your titles and thumbnails.
Why did my Shorts views drop suddenly?
Check three things. First, do your Shorts reuse other creators' clips? YouTube cut reach for re-uploaded Shorts from 1 October 2026. Second, your viewed versus swiped away rate in the Shorts analytics. Third, whether one Short went viral recently, since the following Shorts usually return to your normal level. The Shorts feed line in your traffic sources shows when the fall started.
Why are views dropping on my old videos?
Old videos often live on Suggested traffic from other videos or on search. If a big video that recommended yours slowed down, your old video slows with it. If a newer video now ranks above yours in search, search traffic falls. Click the Suggested videos and YouTube search sources in Studio to see which source shrank for that video.
Can YouTube remove views from my video?
Yes. YouTube Help says it may temporarily slow down, freeze or change a view count while it checks views, and it discards low quality playbacks. That is why a count can go backwards by a small amount. A large removal usually follows views from paid promotion schemes or view exchanges, which break YouTube's fake engagement policy.
Does posting less often cause a drop in views?
It can, mostly through your subscribers. Notifications and the subscriptions feed only send traffic when you post, so a long gap lowers those lines. Upload day matters less than people think: in TubeMind's sample of 405,572 long-form uploads, the share of 2x breakouts was about 19% to 21% on every day of the week.
Do copyright claims reduce my views?
They can. Depending on the rights owner's choice, a claim may block a video in some countries or everywhere, and a blocked video gets no views in those places. Open the Content tab in YouTube Studio and check the Restrictions column for any video whose views stopped suddenly. A claim is different from a copyright strike, which also limits your channel.
YouTube par views kam kyun ho rahe hain?
Aksar wajah ye hoti hai ke koi purani video viral hui thi aur ab channel wapis apne normal level par aa gaya hai. Pehle YouTube Studio mein 365 din ka chart dekhein, phir pichle saal ke isi waqt se compare karein, phir traffic sources mein dekhein ke kaunsa source gira. Strike, copyright claim ya age restriction bhi check karein.